With 2024 coming to a close, we took some time to look at the most utilized SymptomScreen guides of the year. Building on last year’s analysis of the top guides in 2023, we compiled data from all active SymptomScreen accounts to identify which screening guides were used most frequently by agents.
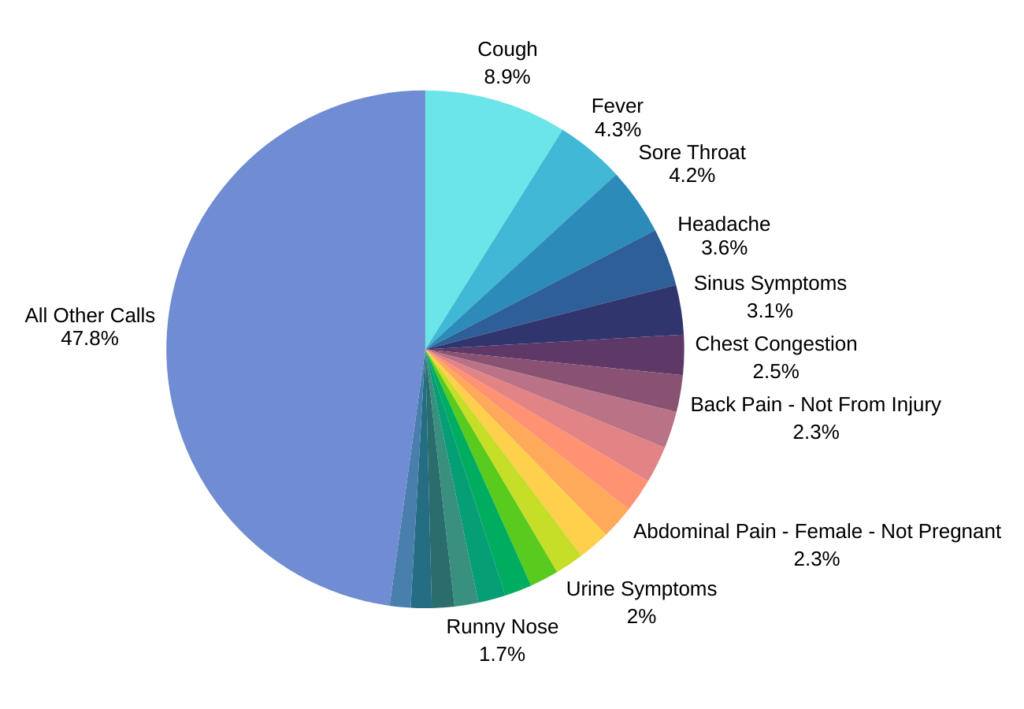
The percentages listed next to each guide in this year’s top 20 represent the percentage of all calls handled in 2024. For example, 8.9% of the millions of calls handled using SymptomScreen this year were related to coughs—a slight decrease from last year.
Much like in 2023, the top 20 SymptomScreen guides accounted for over half of all calls taken this year, despite there being more than 260 guides available. This continues to highlight the critical role these key guides play in addressing the most common patient concerns.
Interestingly, we noticed a similar trend in ClearTriage, where a small subset of telephone triage protocols consistently represented the majority of usage. For a deeper dive into that data, check out our recently published Top Telephone Triage Protocols of 2024 report.
As we look ahead to 2025, we’ll continue refining and expanding SymptomScreen guides to support healthcare teams in efficiently managing patient calls. Stay tuned for updates on how these tools evolve to meet your needs in the year ahead!
Curious about how this year compares to last year? Check out our blog on the Top SymptomScreen Guides of 2023 for a detailed look at last year’s trends.
Top 20 SymptomScreen Guides Used in 2024
- Cough – 8.9%
- Fever – 4.3%
- Sore Throat – 4.2%
- Headache – 3.6%
- Sinus Symptoms – 3.1%
- Chest Congestion – 2.5%
- Back Pain – Not From Injury – 2.3%
- Earache – 2.3%
- Abdominal Pain – Female – Not Pregnant – 2.3%
- Dizziness – 2.1%
- Vomiting – 2.1%
- Urine Symptoms – 2%
- Lethargic (Tired) – 1.8%
- Diarrhea – 1.8%
- Breathing Trouble – 1.7%
- Runny Nose – 1.7%
- Chest Pain – Adult – 1.5%
- Urination Pain – 1.4%
- Body Aches – 1.3%
- Nausea But No Vomiting – 1.3%
Top 20 Guides – Visual Chart

Percentage of total SymptomScreen calls using at least one of the top 20 guides: 52.2%
Which Guides Do My Agents Use?
SymptomScreen includes self-service reporting at no additional cost. Click here to learn more about the reports available in SymptomScreen. To see how your organization compares, run the Guides Used report in SymptomScreen Admin.


